Week 4
Class and Social Stratification
Soci—269
Class, Networks, Inequality–
September 24th
A Quick Reminder
Response Memos
Response Memo Deadline
Your third response memo—which has to be between 250-400 words and posted on our Moodle Discussion Board—is due by 8:00 PM tonight.
Class and Inequality–
Measurement
A Group Exercise
This may sound familiar. In groups of 2-3, think about class inequality. Propose a theory of how “class” divisions emerge and persist.
How could you test your theory?
Once again, think broadly here: e.g., how would you operationalize constructs like class and inequality?
Inequality and Social Ties
(Young et al. 2025)
The Entry Point
Social ties provide access to valuable resources—such as job opportunities, information, and social support—that can increase well-being and facilitate upward mobility … Yet, these same networks can also reinforce and perpetuate inequality when concentrated among the advantaged. Those with well-connected, high-status networks often enjoy greater access to exclusive opportunities, whereas individuals with weaker networks may face persistent barriers to advancement, further compounding inequality … Do personal connections, community interactions, and network resources help diffuse opportunity throughout society, or do they reinforce economic differences and build social closure among the well-off?
(Young et al. 2025:294, EMPHASIS ADDED)
The Entry Point
We focus on two key distributional dimensions of social ties: their quantity and their alignment with economic capital … First, to what extent do some individuals have an abundance of social ties, while others have very few? … Second, what is the relationship between social ties and income? Do high-income individuals also have larger and more advantageous social networks than low-income earners? A weak correlation would suggest that social and economic resources operate as distinct domains—some individuals may have high income, whereas others are rich in social connections. This is similar to Weber’s idea that dimensions such as “class” and “status” represent separate axes of societal differentiation.
(Young et al. 2025:294–95, EMPHASIS ADDED)
The Research Questions—Reframed
The Research Questions—Reframed
The Research Questions—Reframed
The Findings
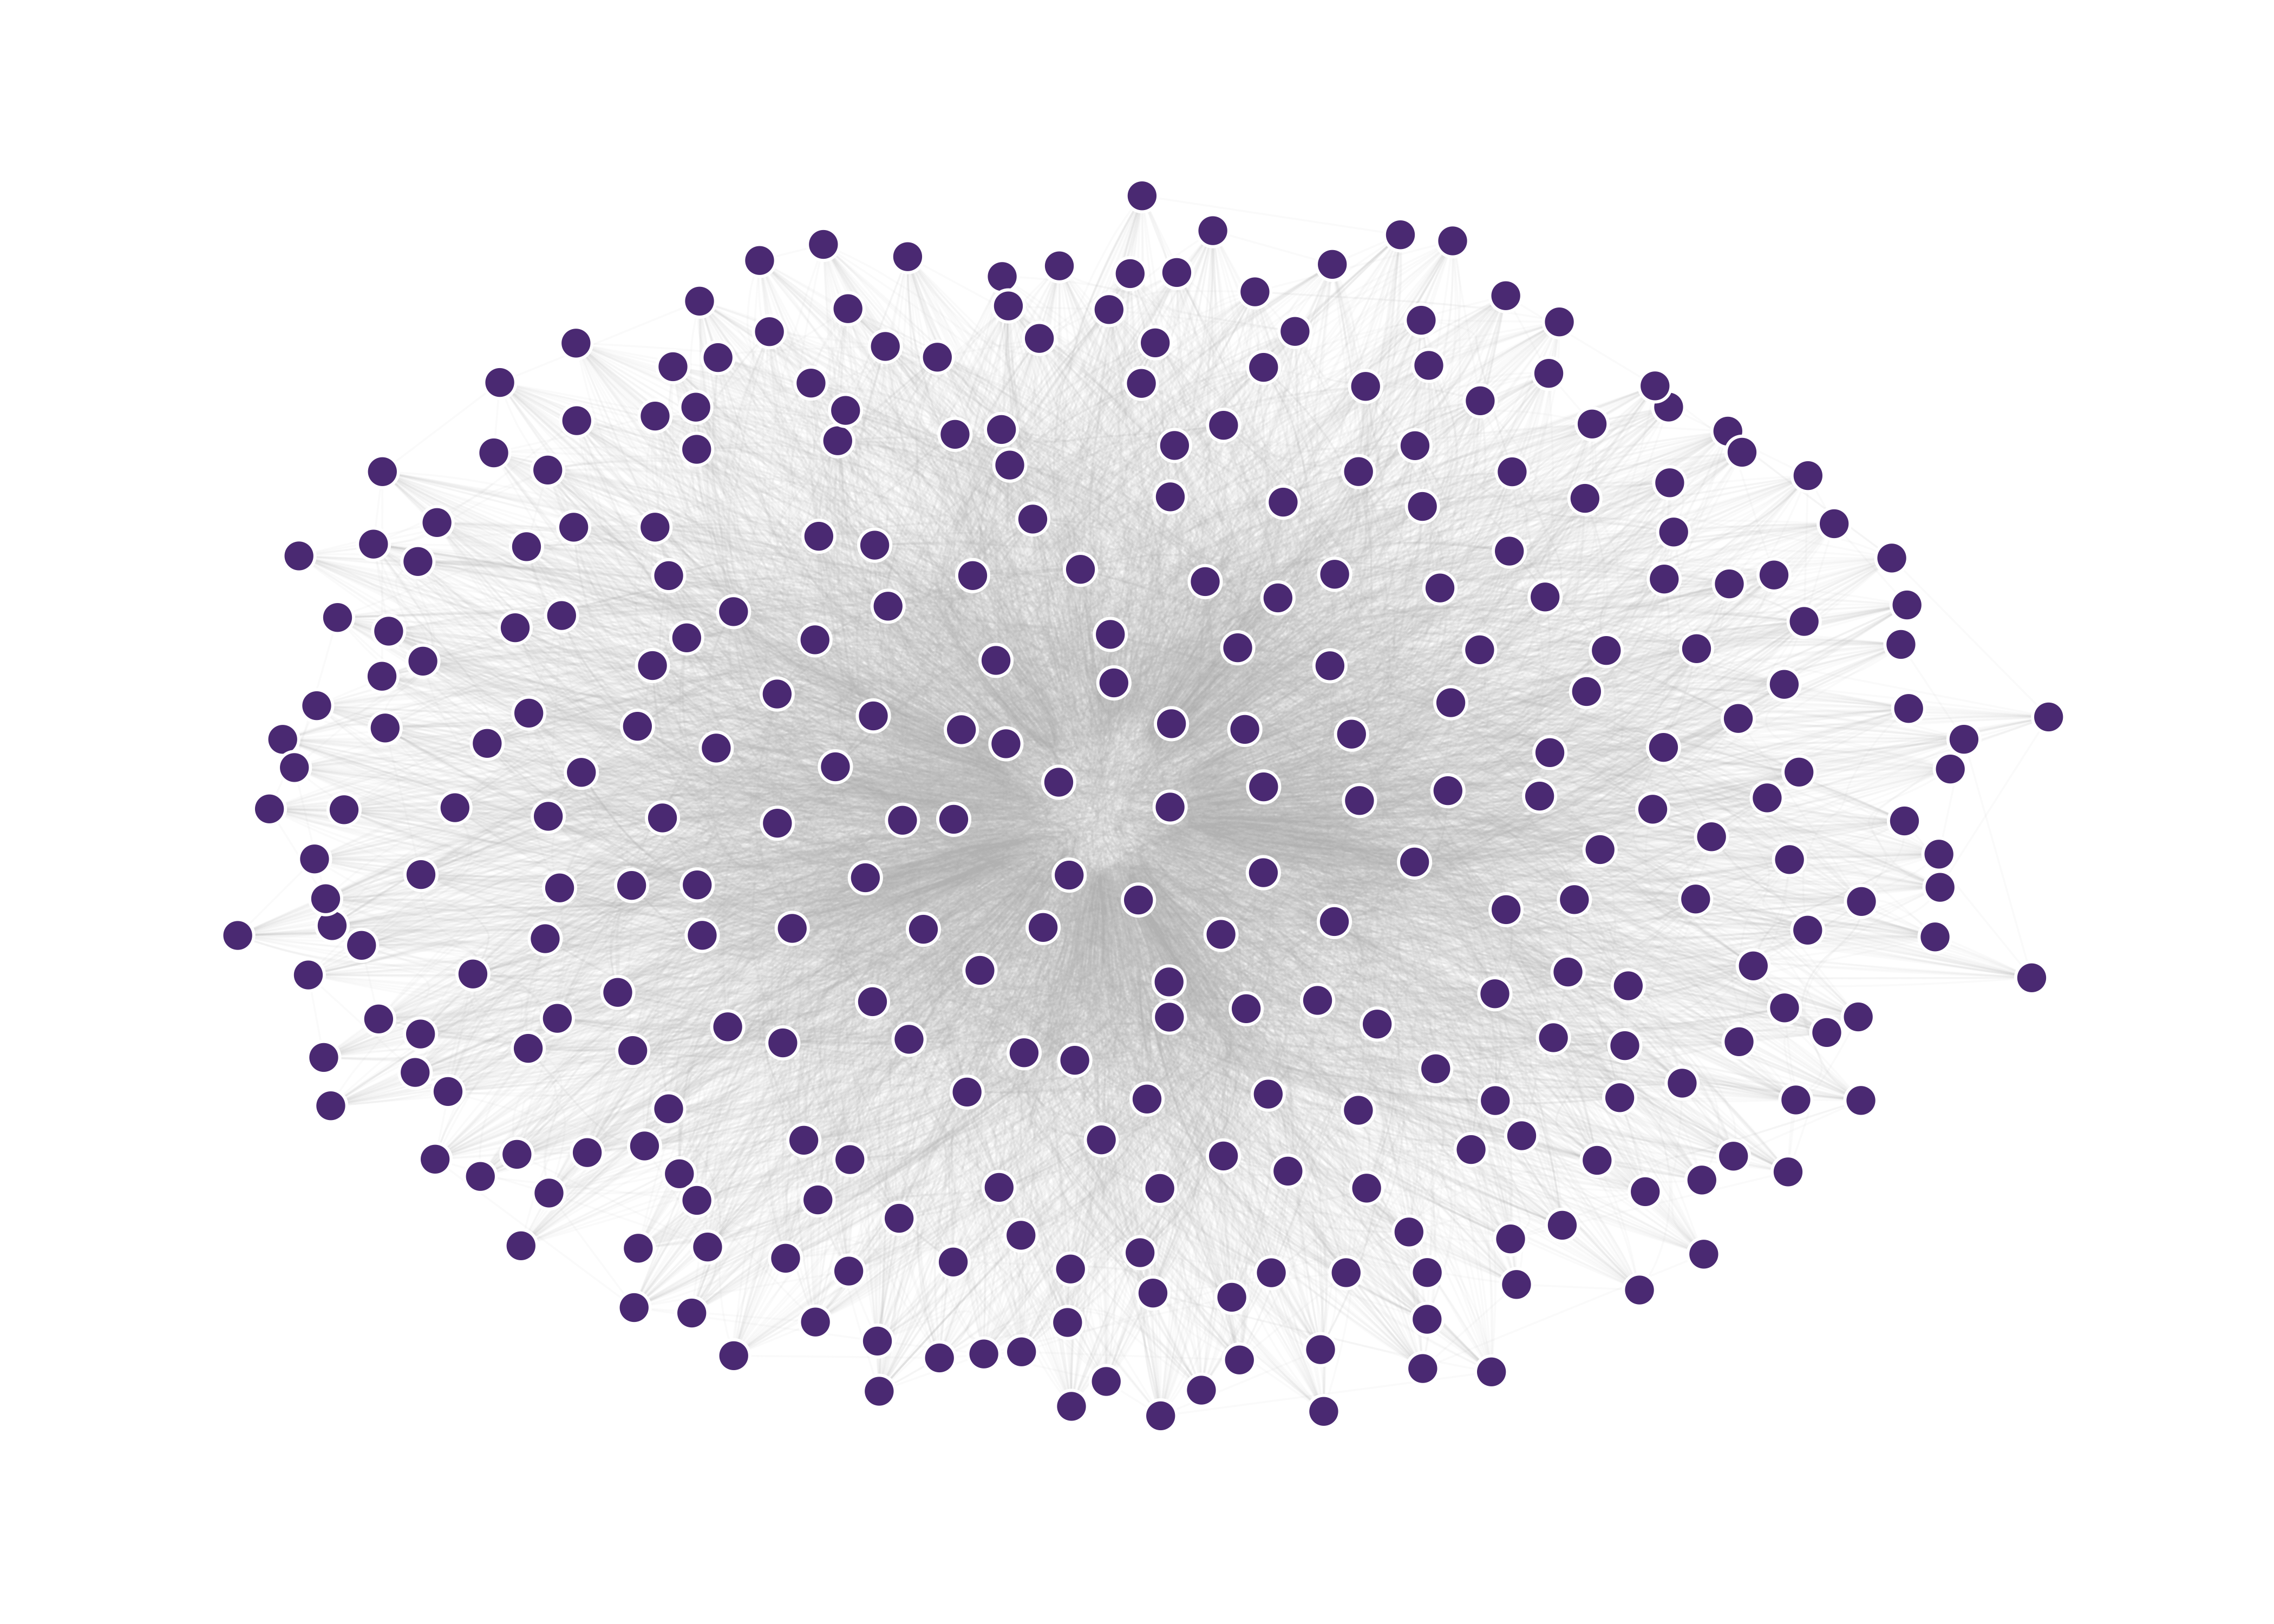
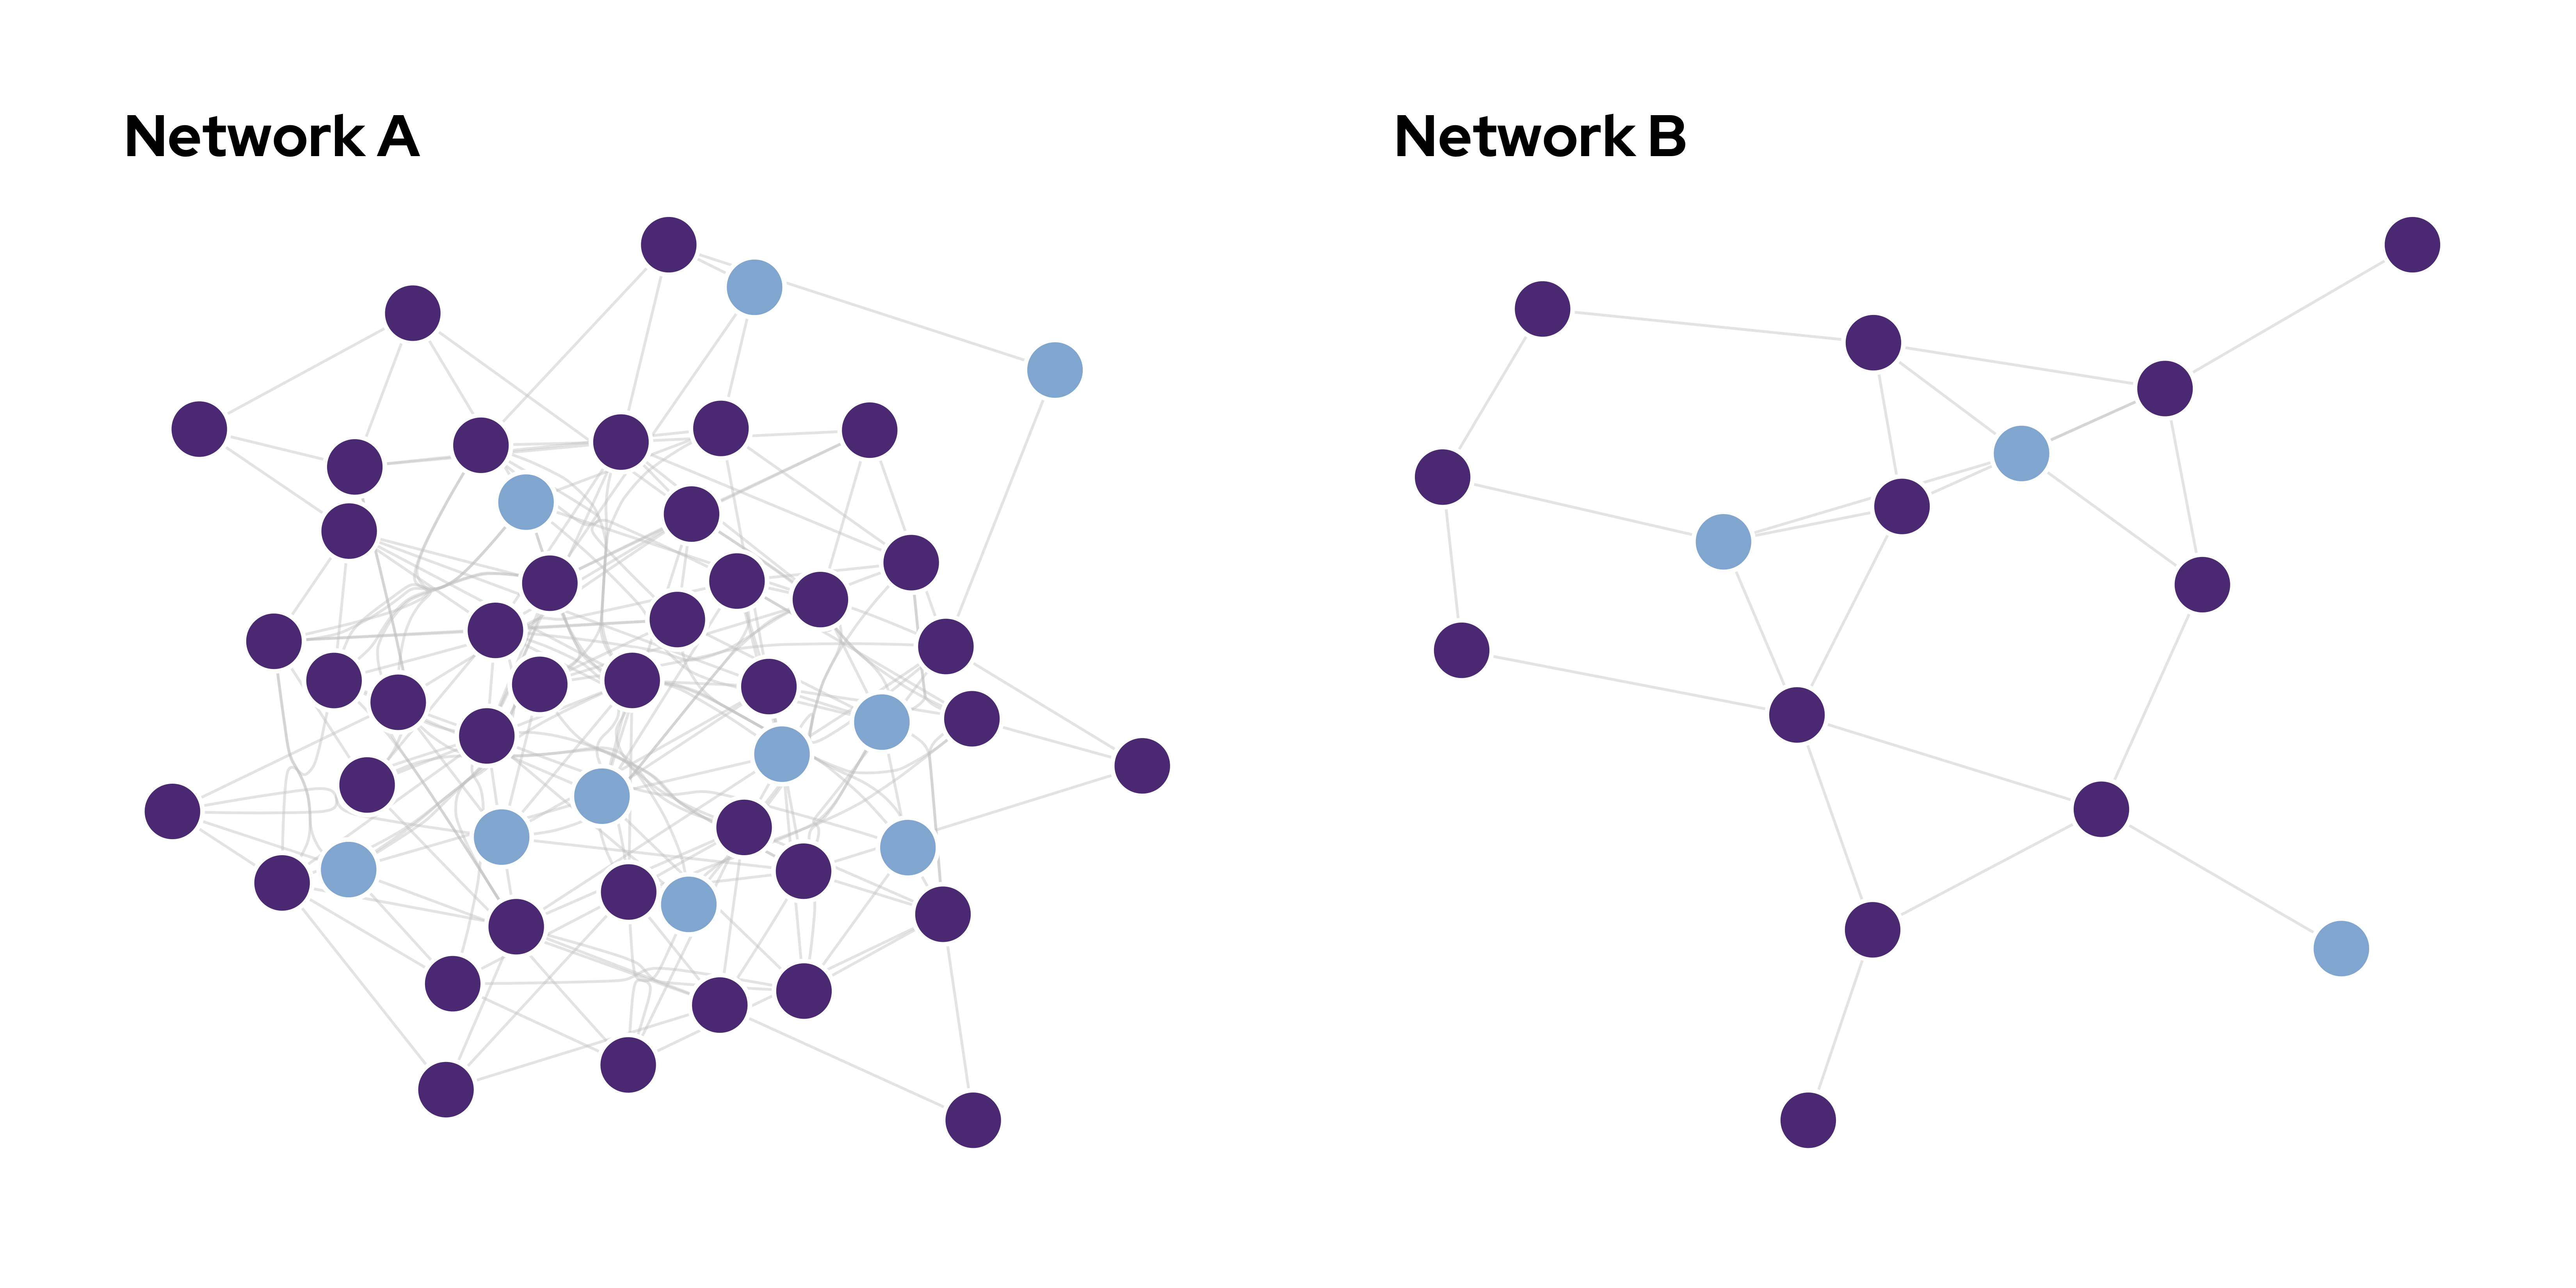
Personal Networks
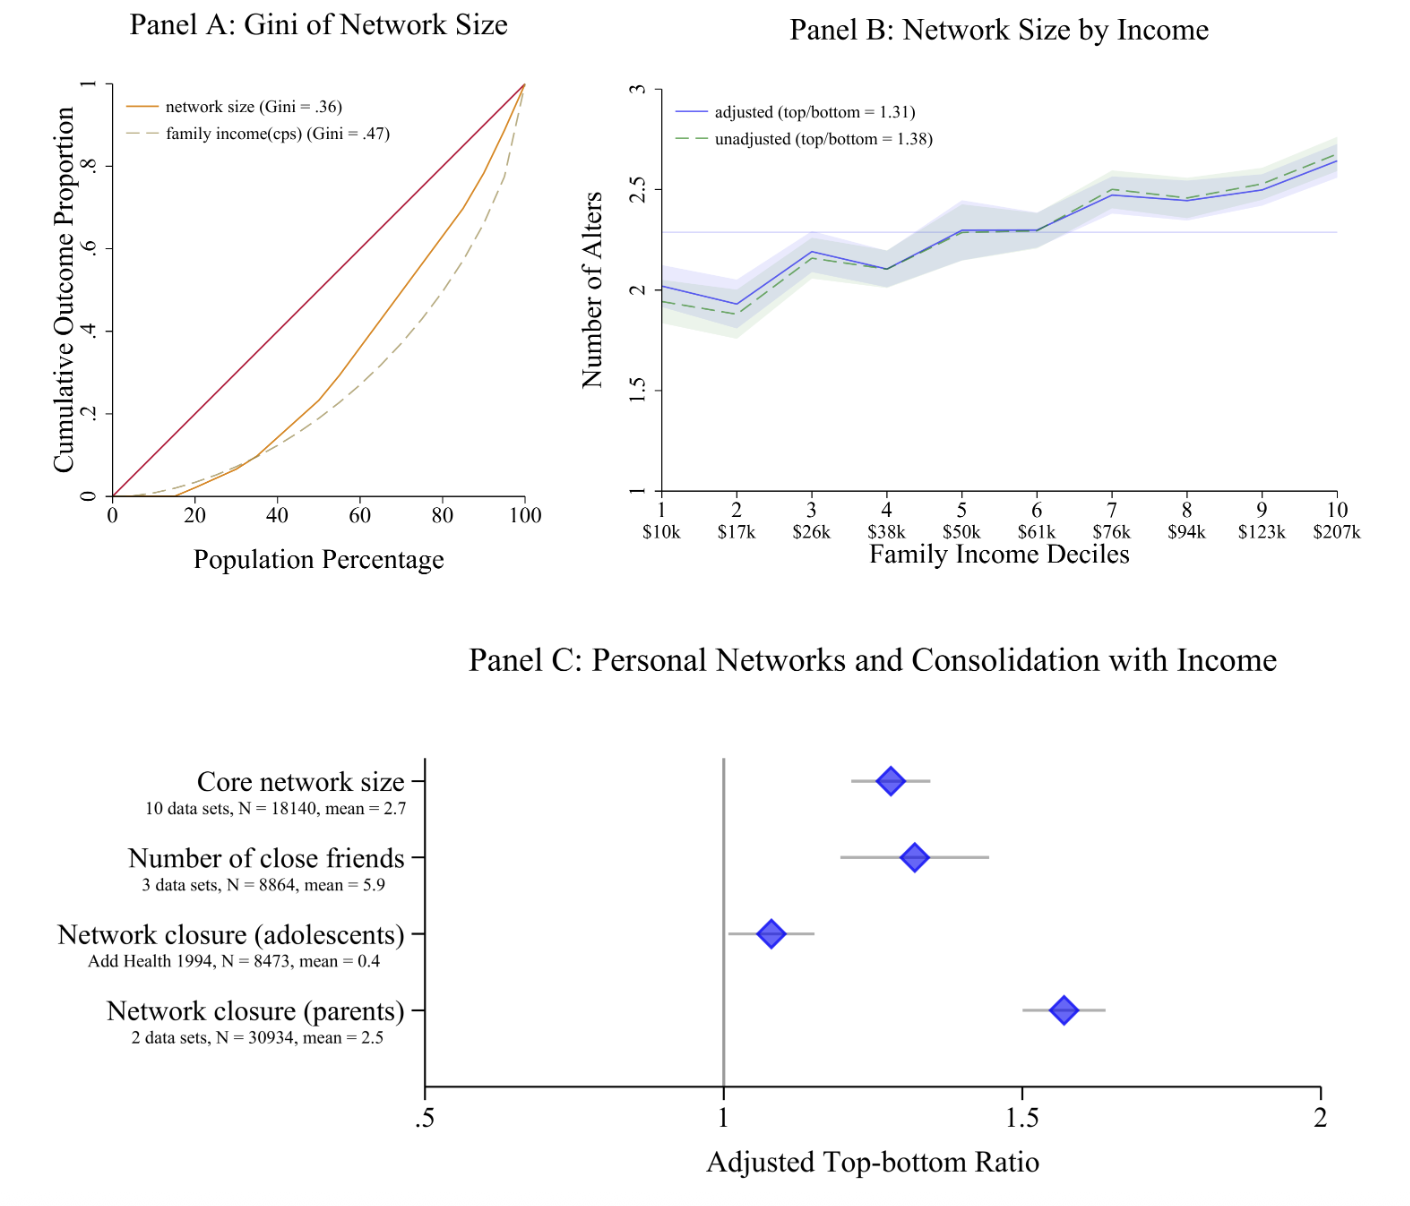
Figure 1 from Young and colleagues (2025). Click to expand.
The Findings
Group Memberships
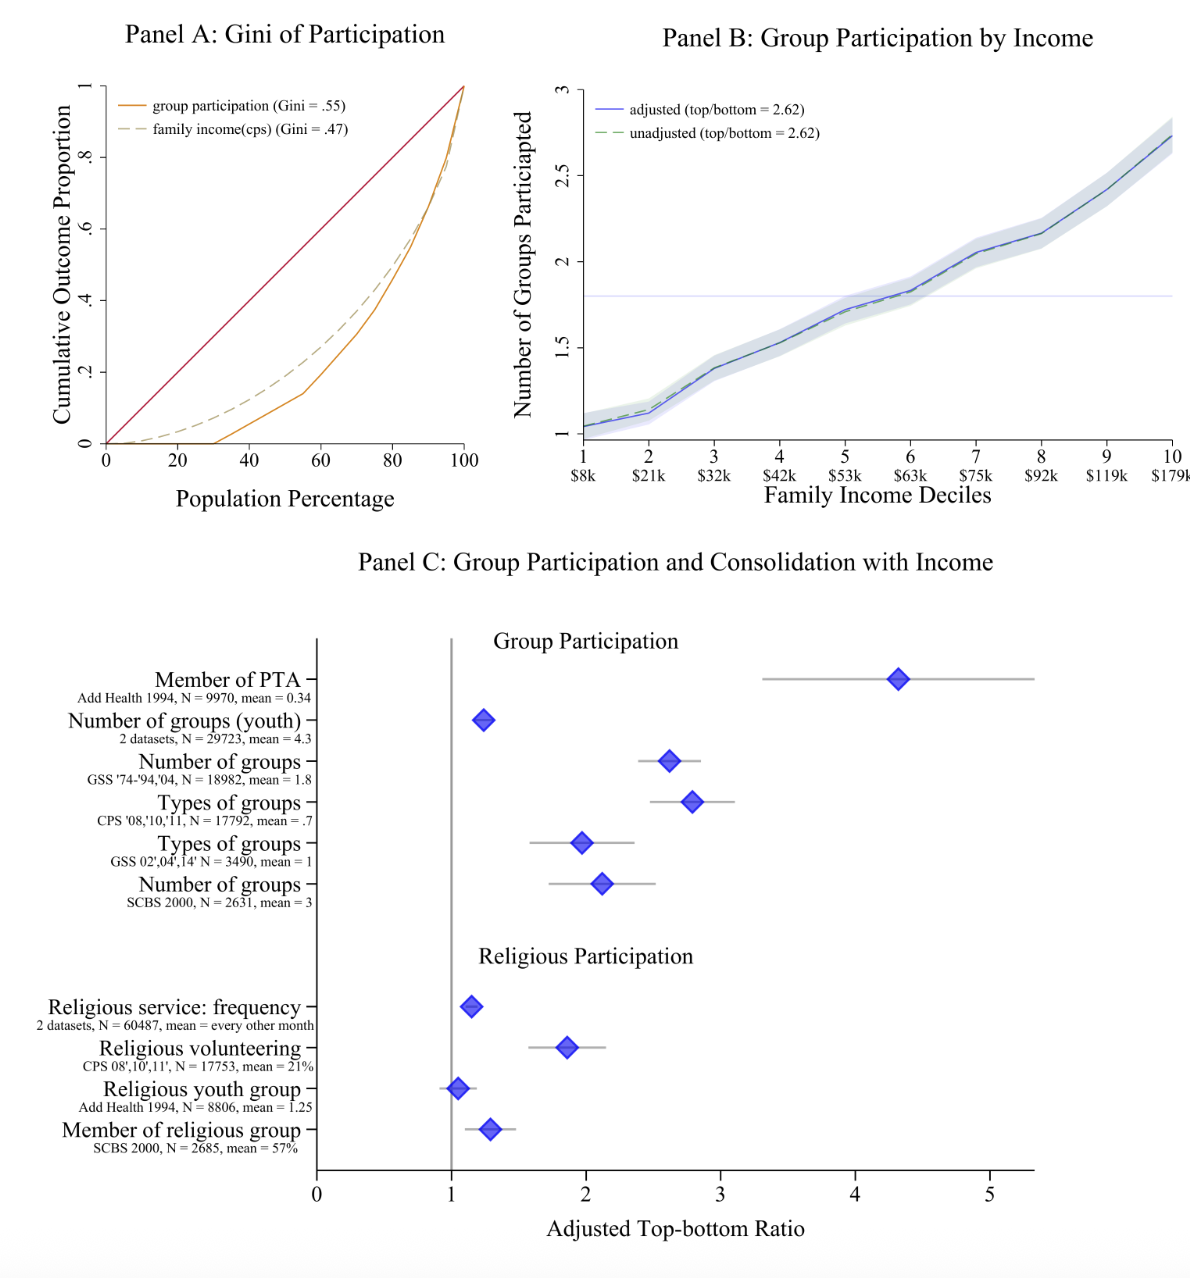
Figure 2 from Young and colleagues (2025). Click to expand.
The Findings
Network Resources
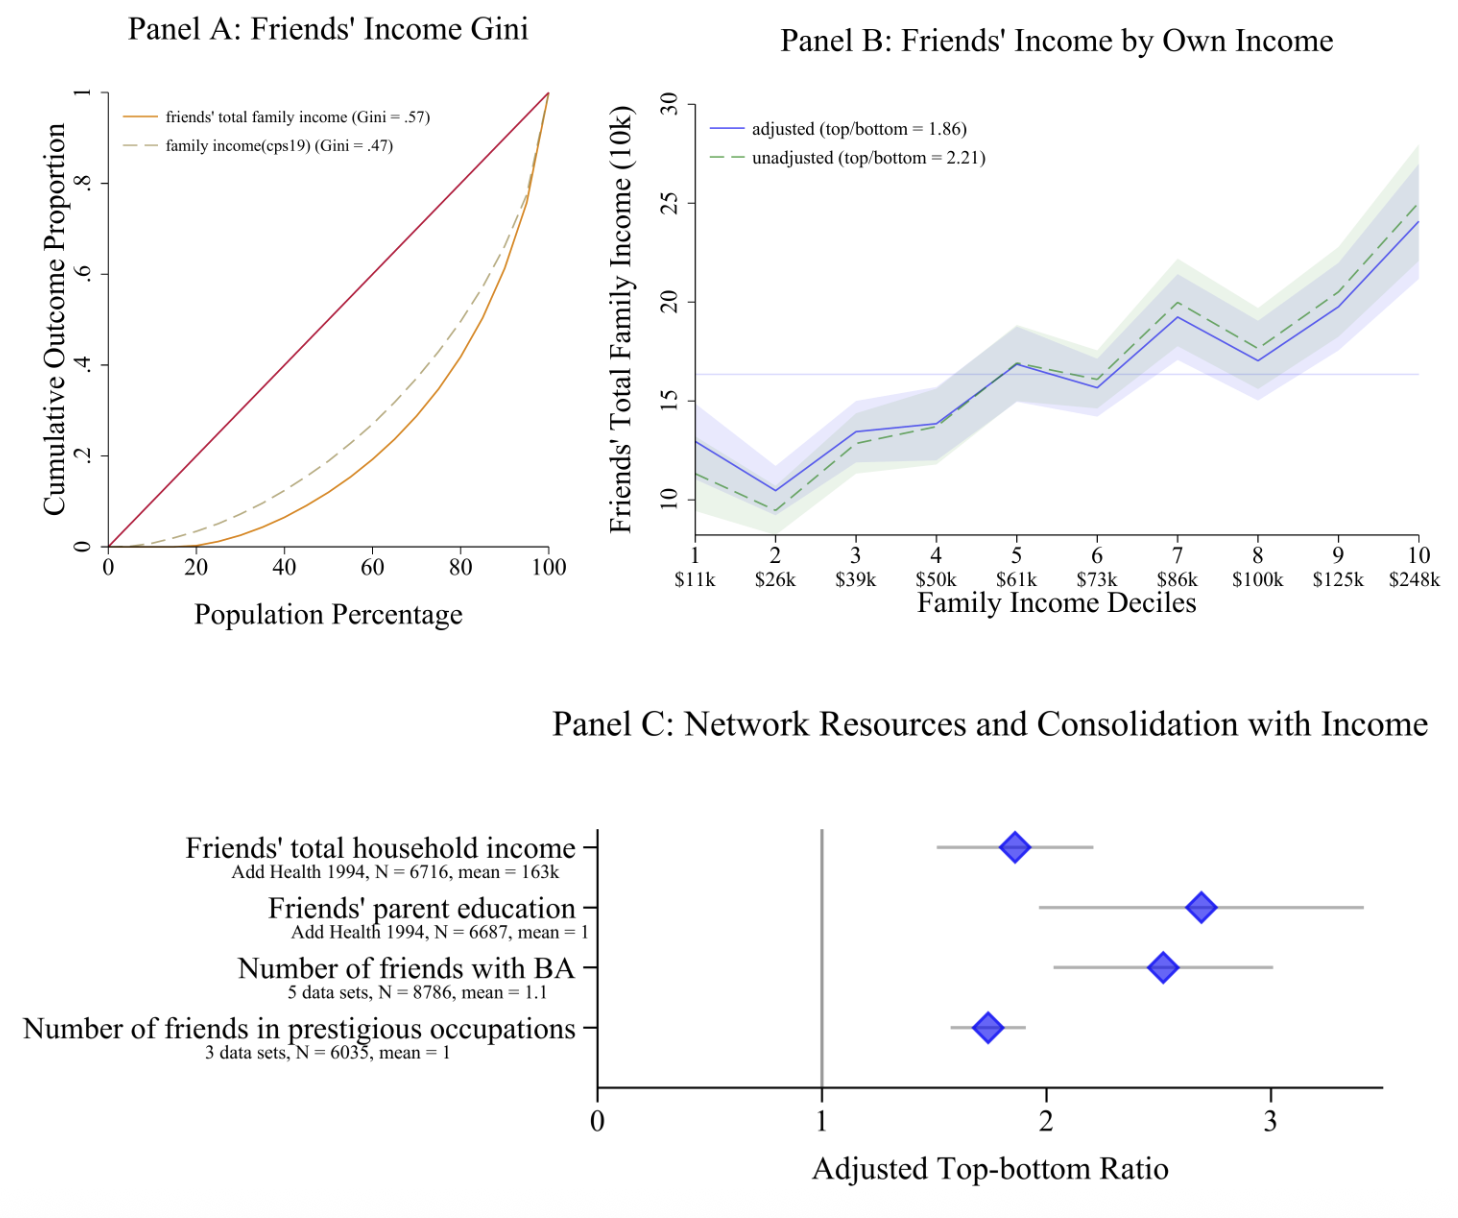
Figure 3 from Young and colleagues (2025). Click to expand.
The Findings
Job Search
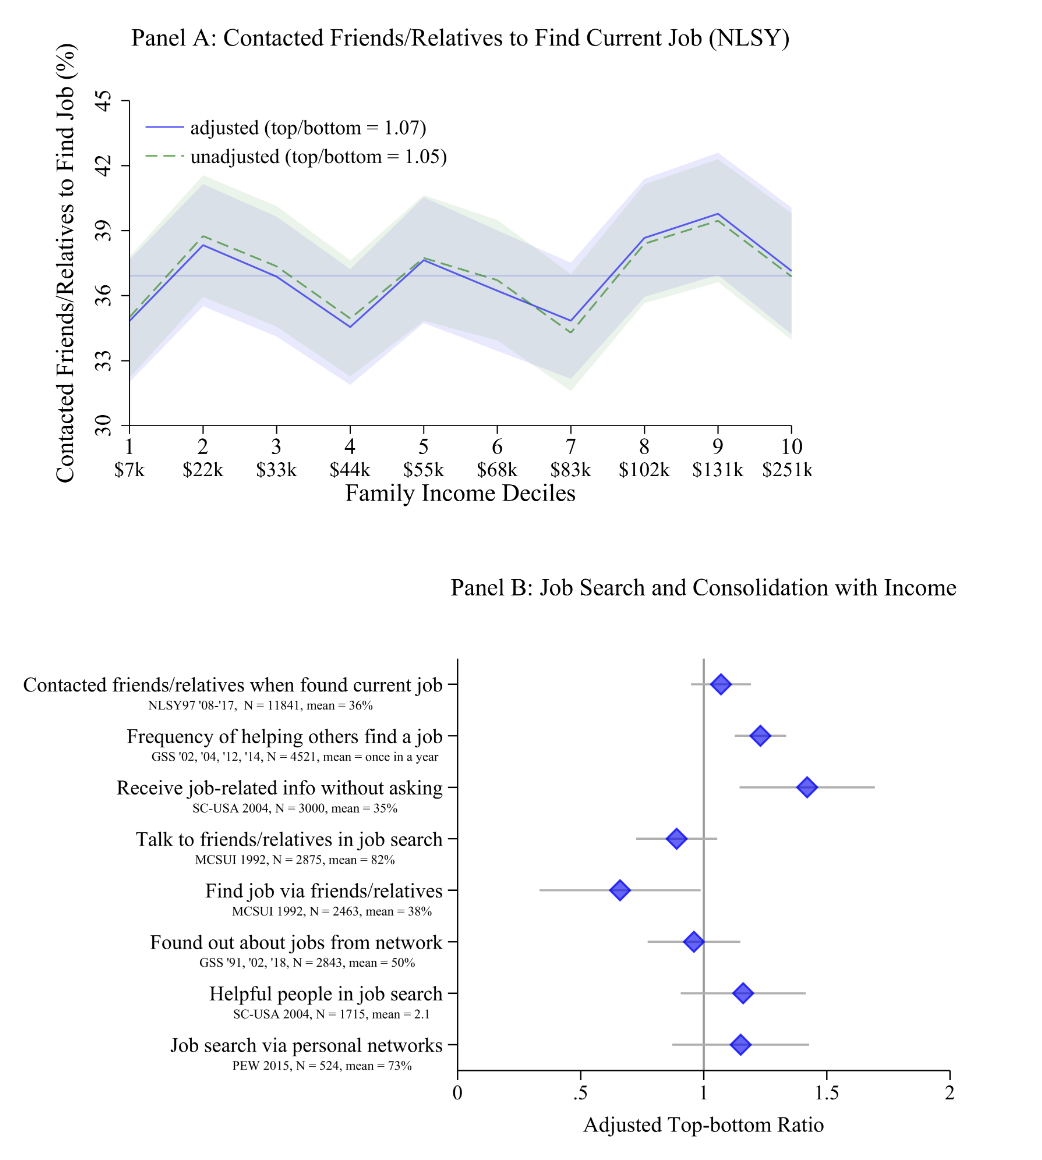
Figure 4 from Young and colleagues (2025). Click to expand.
The Findings
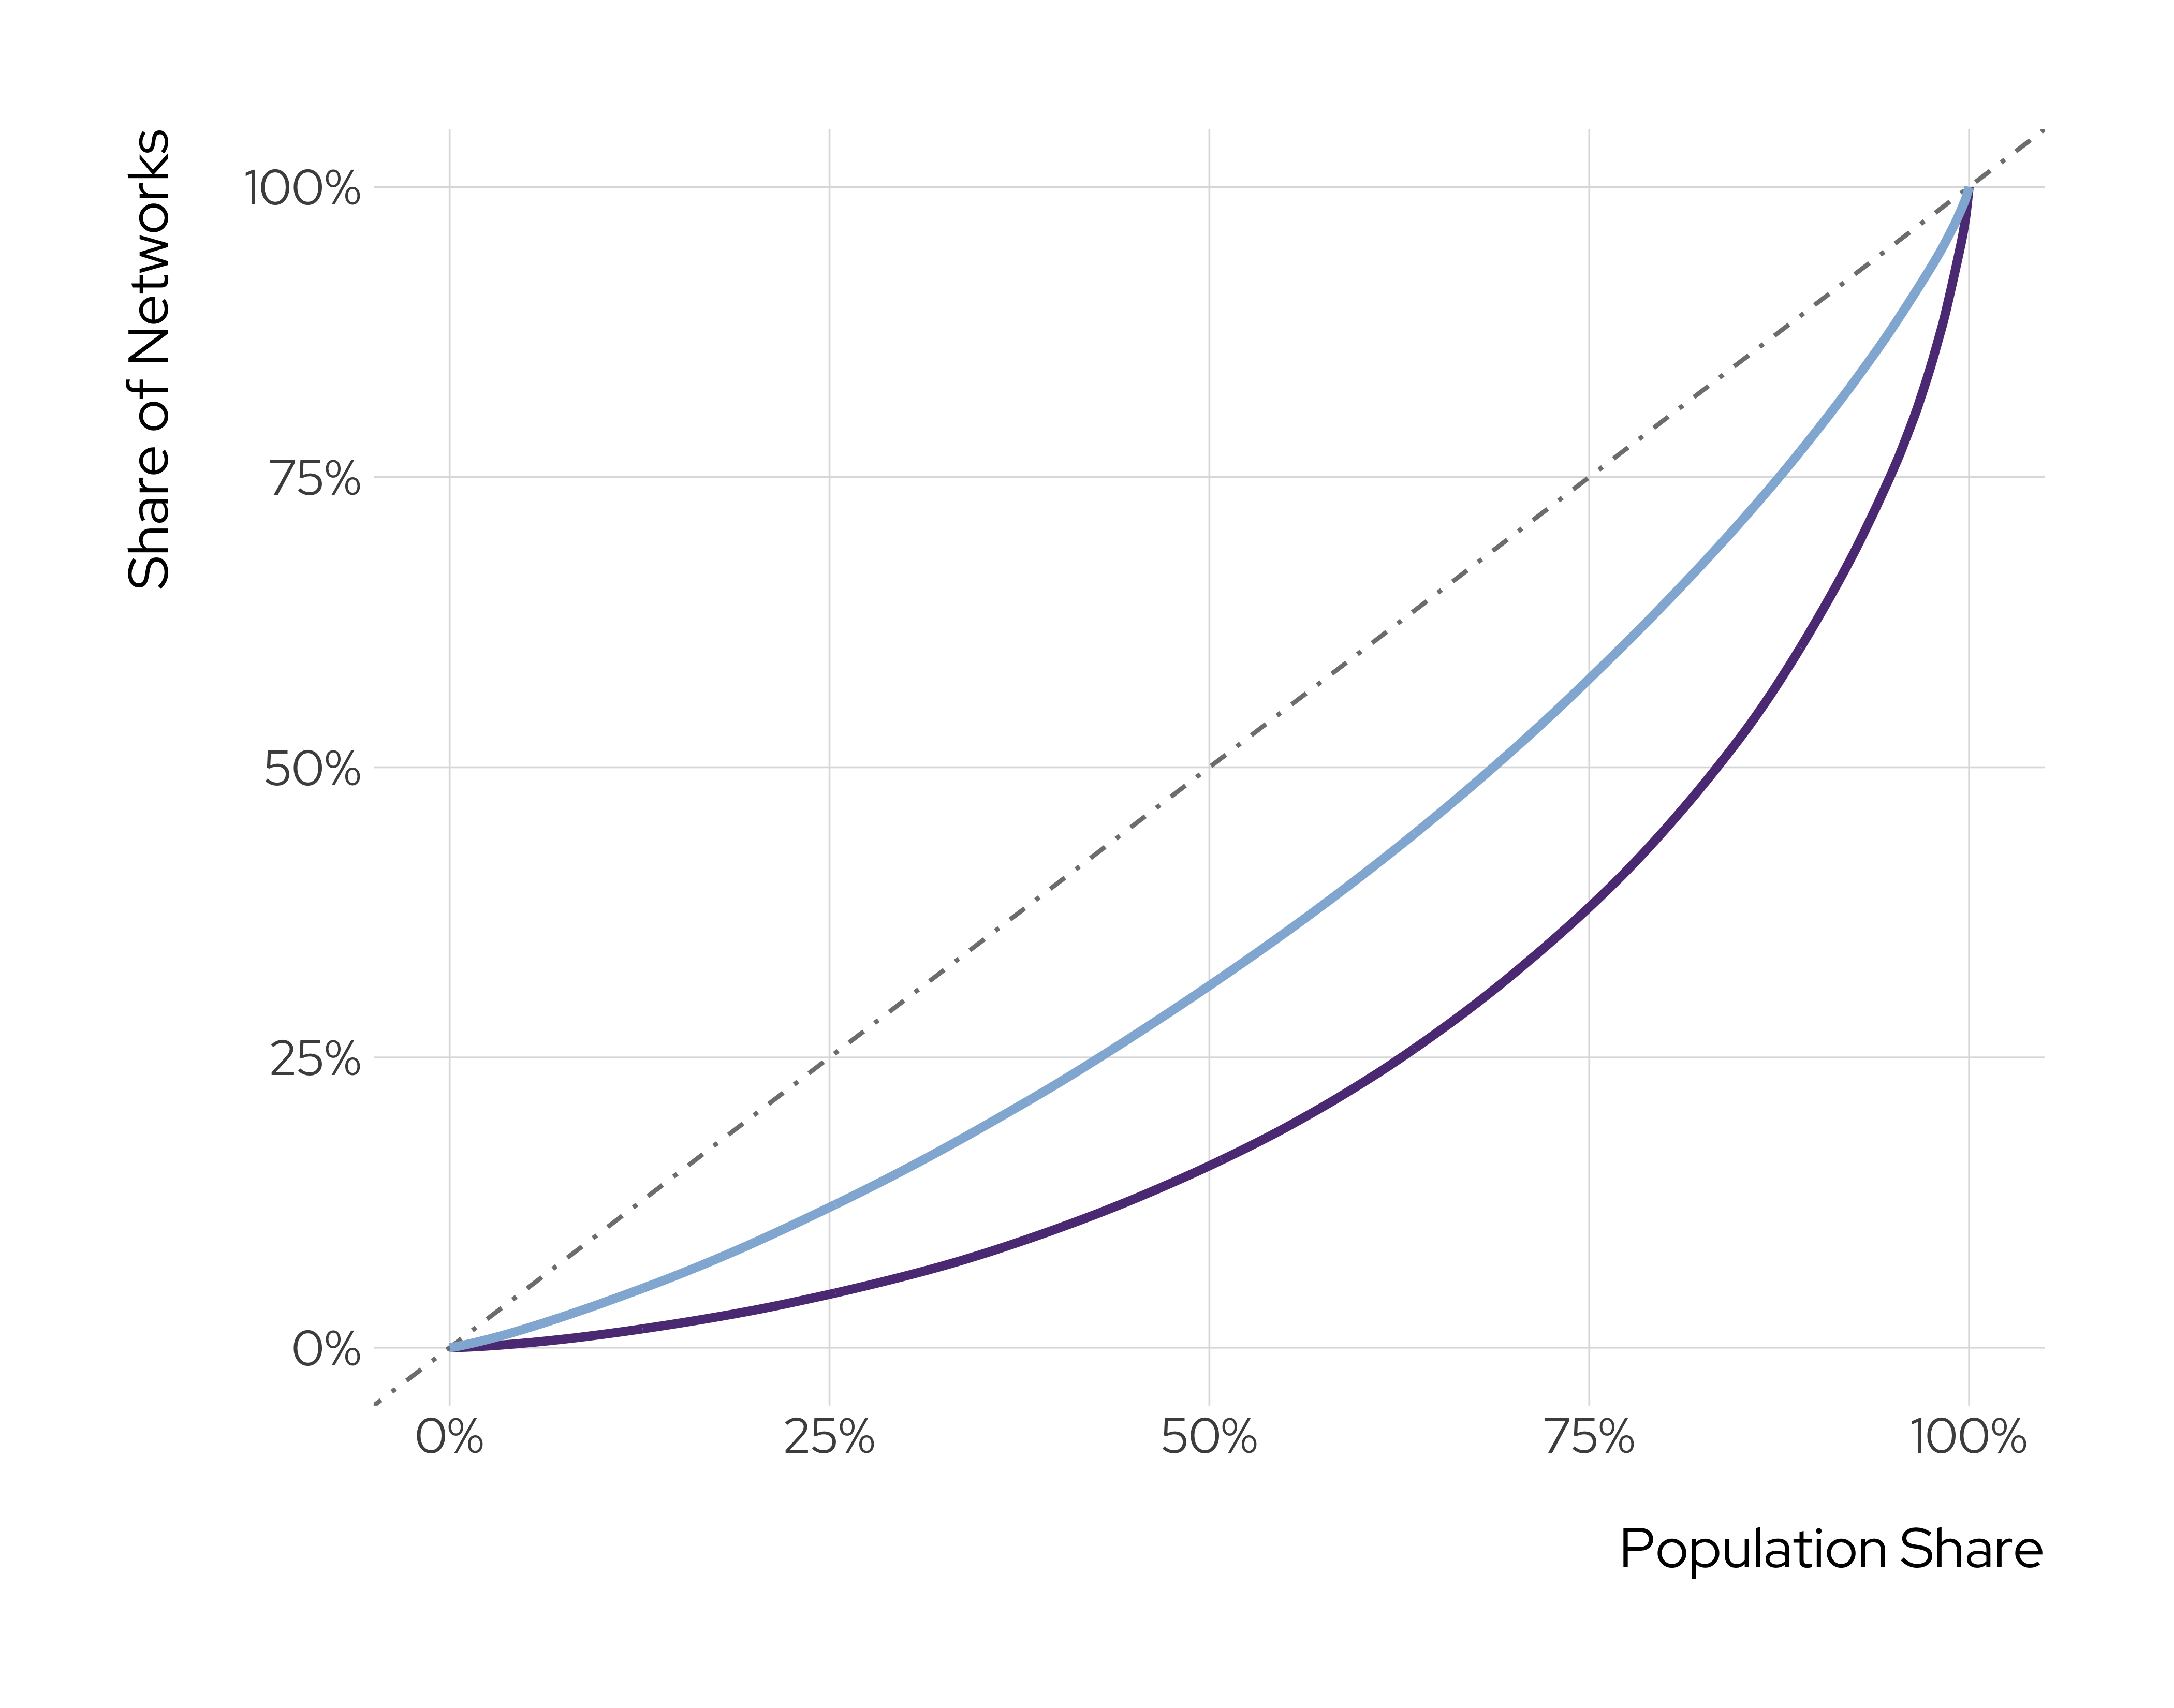
Aggregate Inequality-Consolidation Curve
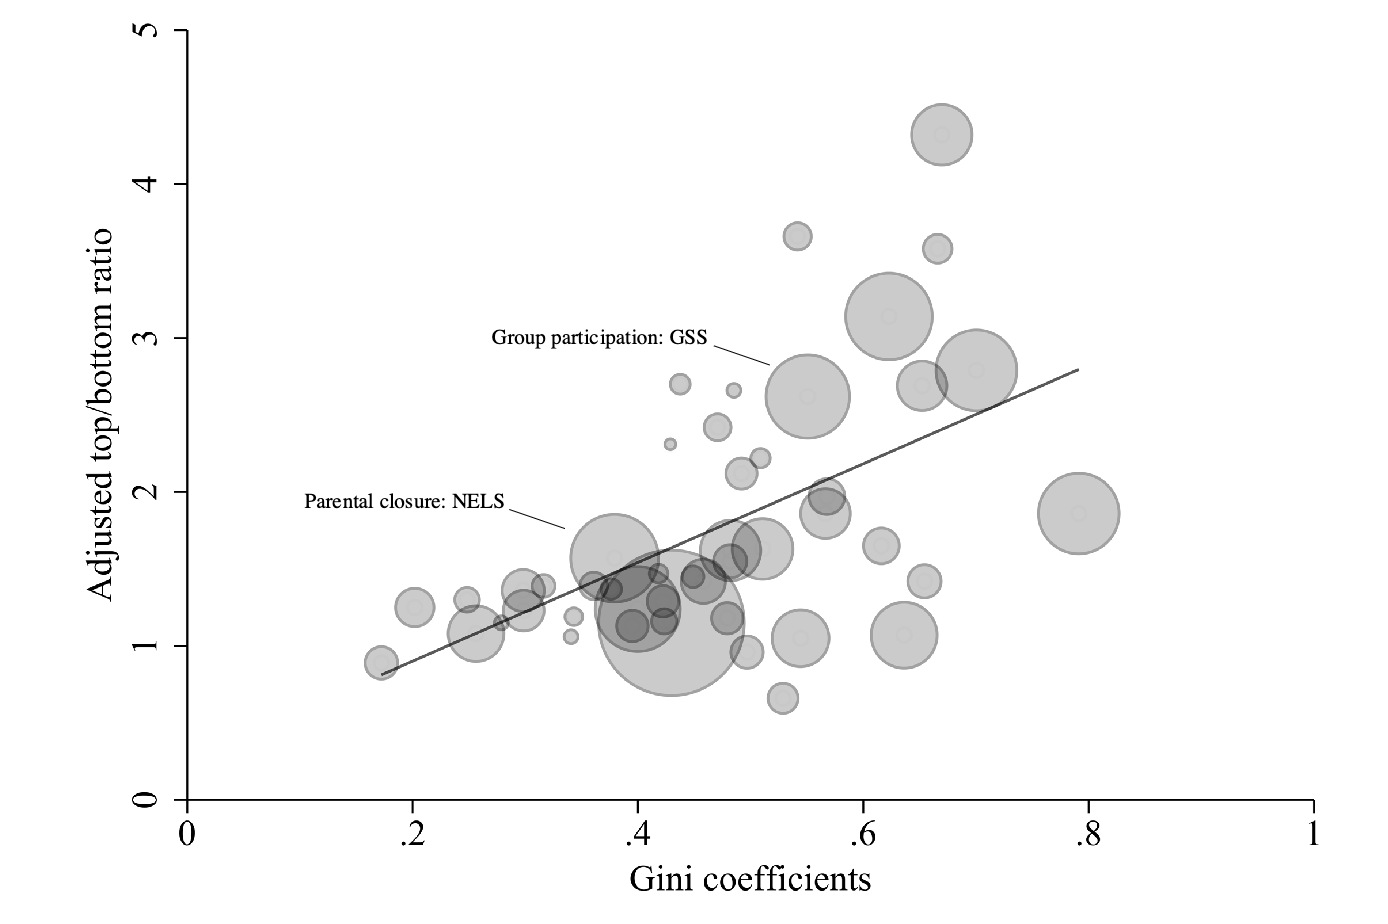
Figure 5 from Young and colleagues (2025). Click to expand.
A Quick Classroom Discussion
Homophily, Consolidation and Inequality
The Multiverse
(Engzell and Mood 2023)
An Animating Question
The late-twentieth century saw earnings and wealth inequality rise in most Western countries. This has sparked concerns about the consequences for younger generations. Do increased disparities mean a child’s family of upbringing has become more important as a predictor of their attainment as an adult? Research to date provides no conclusive answer: studies in the United States and in Scandinavia—the context of this study—report everything from no trend to a decrease in income mobility, or even a slight increase.
(Engzell and Mood 2023:600, EMPHASIS ADDED)
An Animating Question
A Question About a Question
What explains these inconsistent findings?An Animating Question
The literature on intergenerational income mobility works with a wide range of models and definitions. While the question “Has mobility decreased?” is generic, different models can speak to different estimands (Lundberg, Johnson, and Stewart 2021). If so, variation is an irreducible feature, and no matter how much data we have, studies may not converge on a single answer.
(Engzell and Mood 2023:601, EMPHASIS ADDED)
An Animating Question
As we will argue, the way forward lies in treating model variation not as a nuisance but as an indispensable source of information. We ask how levels of and trends in intergenerational income mobility depend on the choice of income concept, differences between men and women, the age and period at which income is measured, how zero values are treated, and the parameter of association. Our use of a single high-quality dataset lets us abstract from variation due to context, sampling, or measurement error. We examine 20 cohorts and 82,944 alternative specifications.
(Engzell and Mood 2023:601, EMPHASIS ADDED)
A Model of Intergenerational Mobility
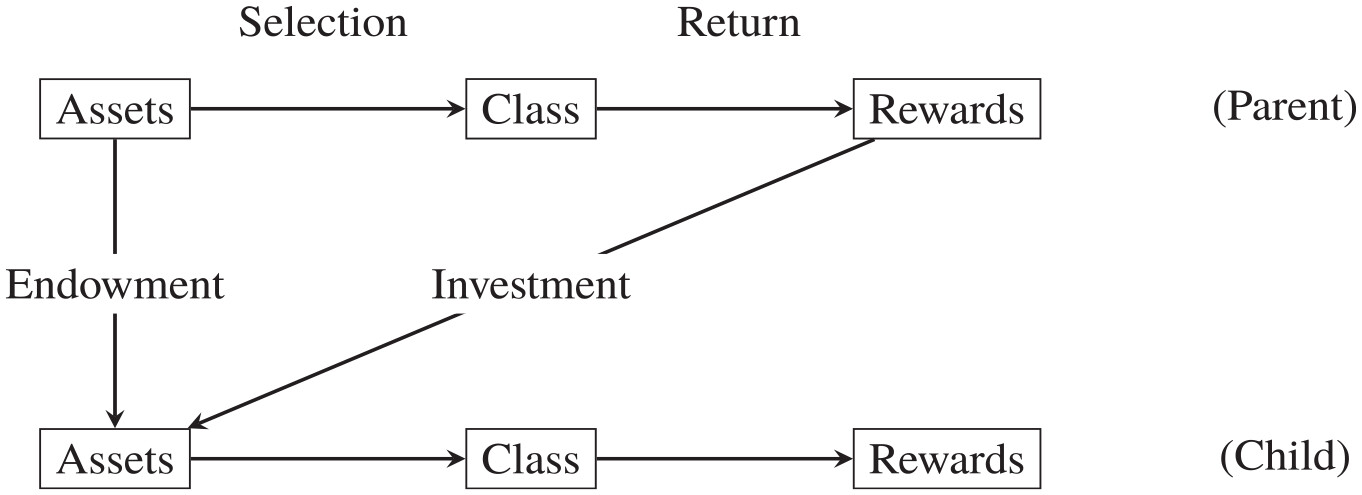
Figure 1 from Engzell and Mood (2023).
Select Results
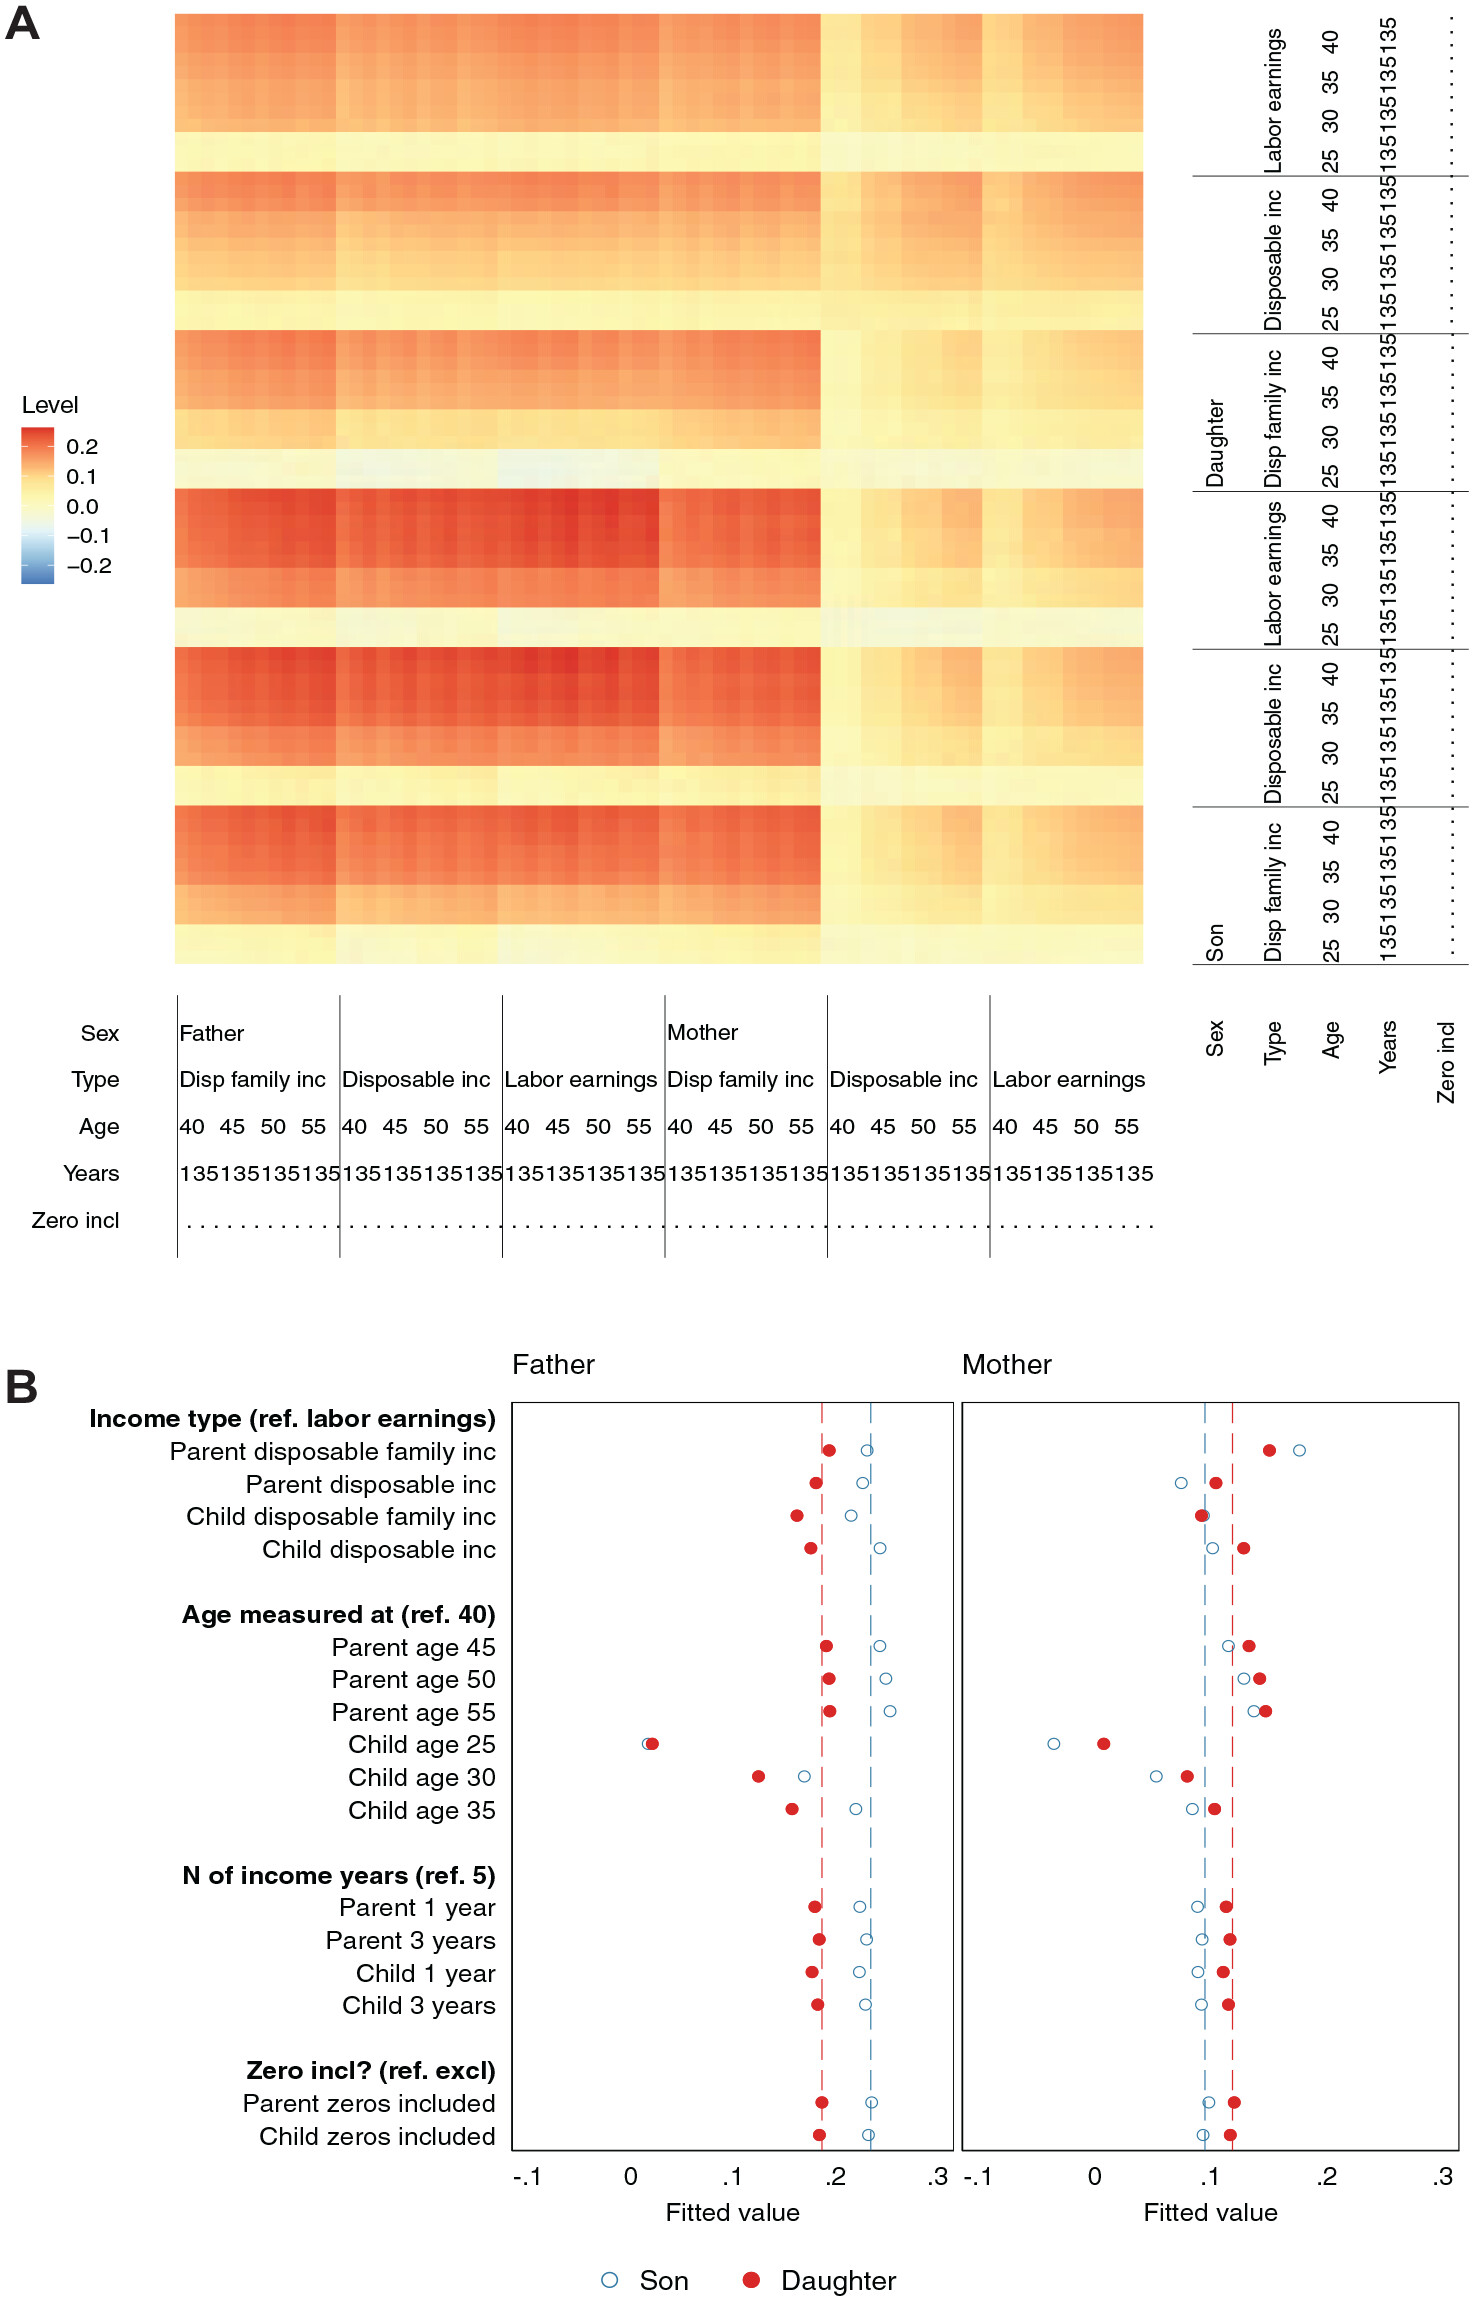
Figure 3 from Engzell and Mood (2023). Click to expand.
Select Results
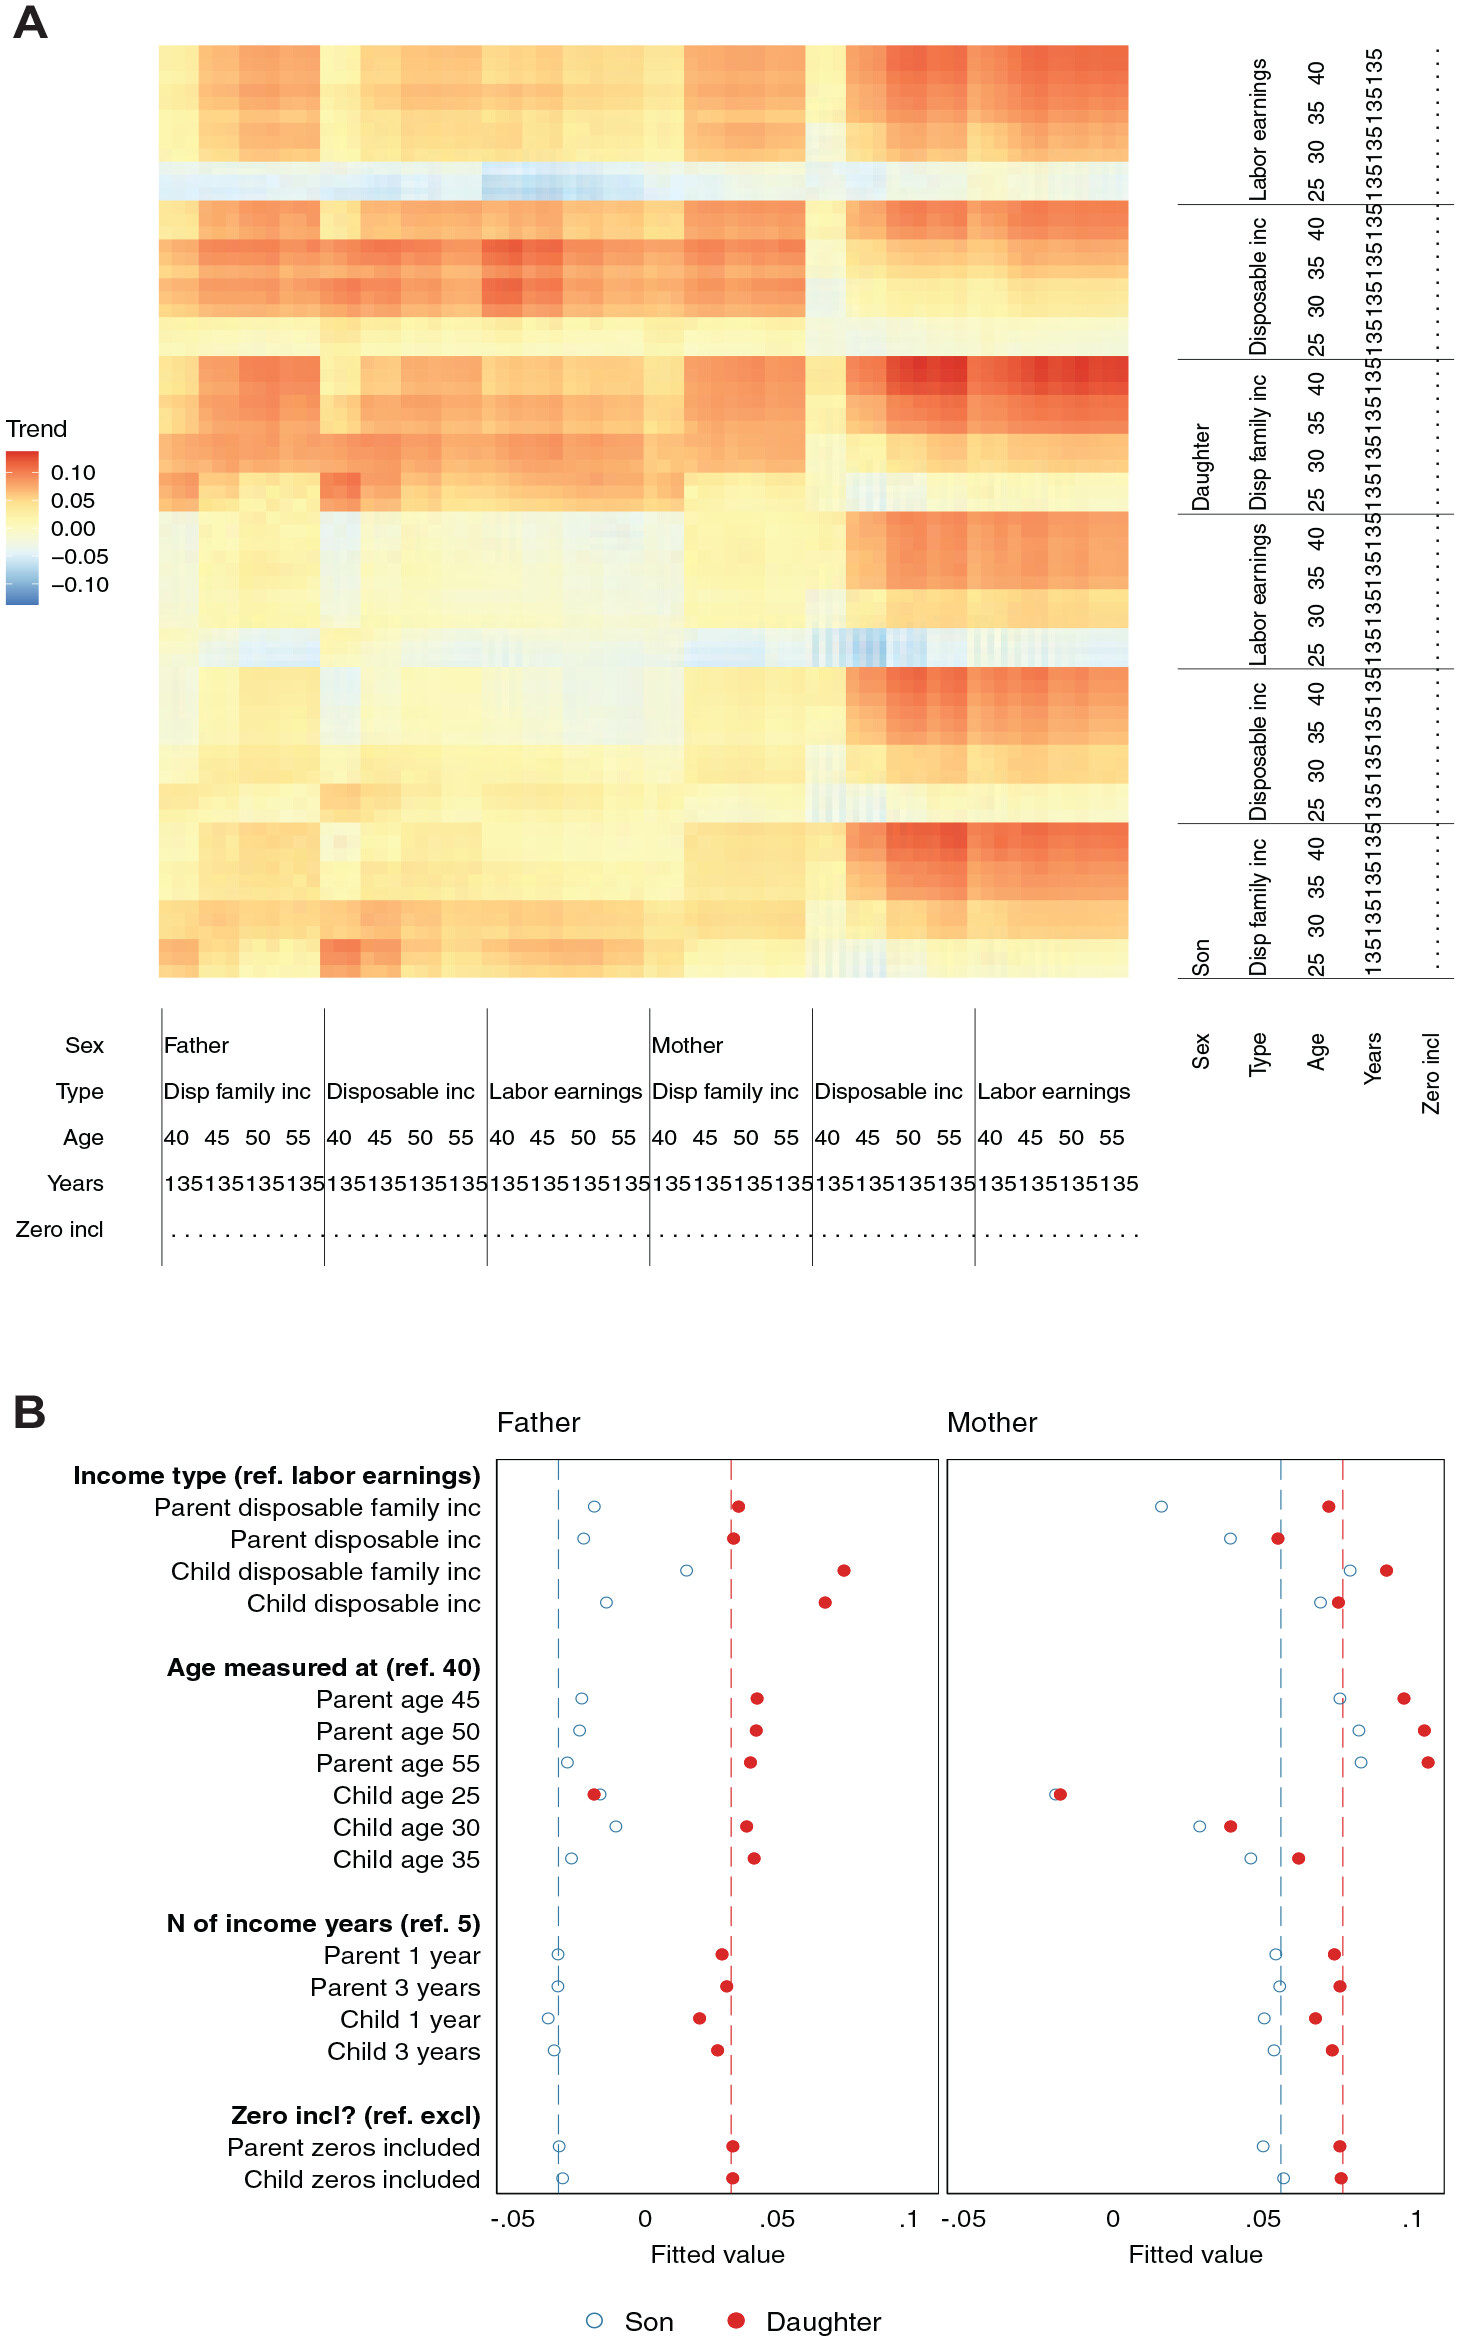
Figure 4 from Engzell and Mood (2023). Click to expand.
Select Results
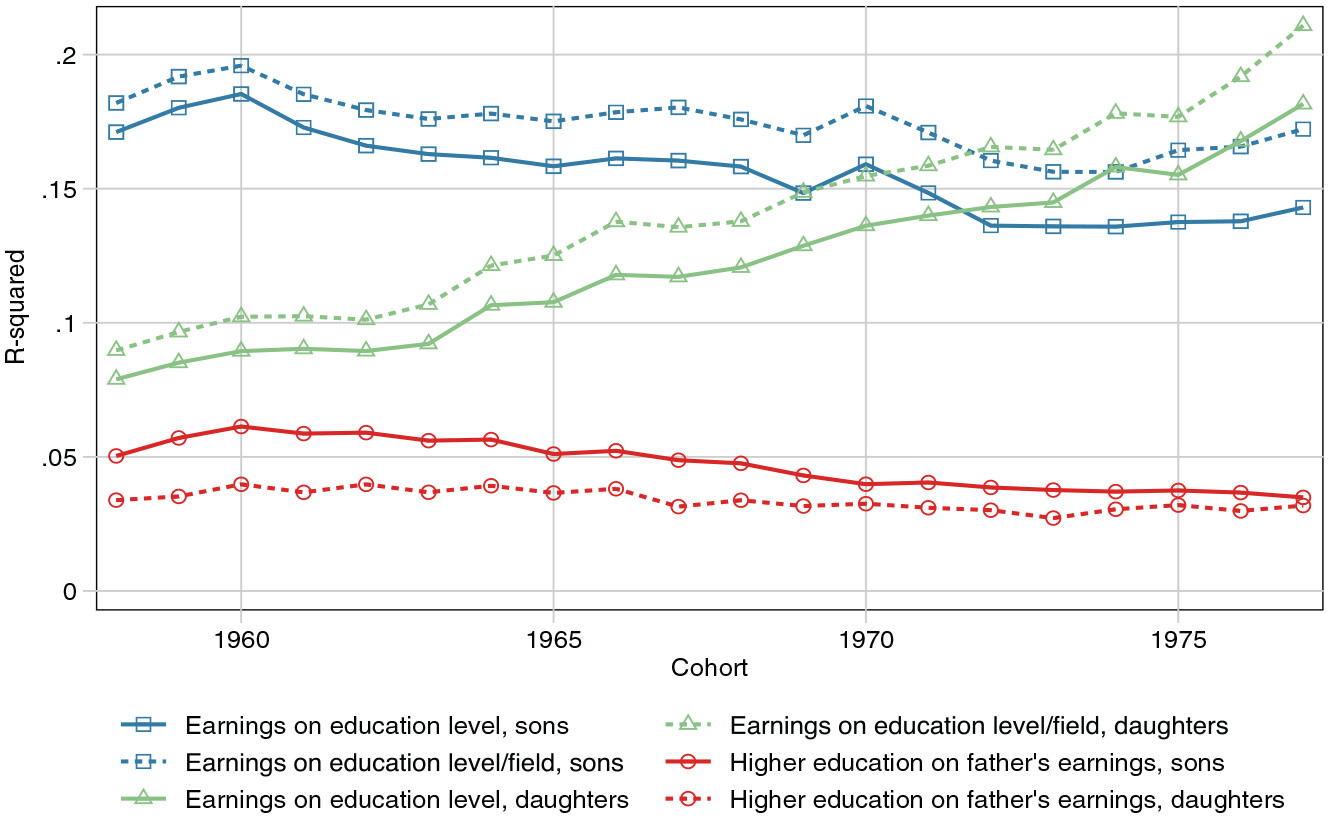
Figure 6 from Engzell and Mood (2023).
The Revised Theory
Selecting a given specification to test a prediction such as “mobility is declining,” we would have been likely to confirm it. By contrast, examining the full model space we can begin to address questions not only of if but why. In our case, the striking conclusion is that rising gender equality, not inequality, is the main driver of declining income mobility in Sweden today. Intergenerational correlations rise over time because women’s earnings become a better proxy for their underlying human capital, and this also influences family income. Our results show that rising intergenerational persistence can be a result of something most would see as desirable: gender equalization in the labor market.
(Engzell and Mood 2023:619, EMPHASIS ADDED)
Note
For another paper on the intergenerational transmission of “class” in Sweden, see Engzell and Wilmers (2025).
Another Group Discussion
Battling “Researcher Degrees of Freedom”
A Final Group Discussion
Segregation and Inference
Mijs and Usmani (2024) posit that segregation ruins inference. What in the world are they talking about? How did they arrive at their conclusions? Discuss in groups of 2-3.
Enjoy the Weekend
References
Note: Scroll to access the entire bibliography